Ultrarunning
I didn't always like running. In fact, I kind of hated it. During grad school, though, it started to grow on me. I loved the challenge and the way trail running let me spend hours in nature while pushing myself. Over time, my runs got longer: first 18 miles from Estes Park to Grand Lake, then 28 on Aspen's Four Pass Loop, and this year, my first 50k. It's safe to say I'm hooked. I'm already considering a 50 miler next year.

Figure 1: From the Sawatch Ascent 50k. Photo taken by Jordan Chapell.
Why Ultrarunning
Training for a 50k was really fun and rewarding. I loved building a plan, figuring out fueling, and balancing it with the rest of life. It became a grounding routine and, honestly, a natural extension of who I am. I like long-term goals and the satisfaction of consistent, deliberate progress.
Naturally, I couldn't resist analyzing my training data (as any data scientist would; I don't make the rules). My watch gave plenty of "fitness metrics," but many felt like black-box guesses. I was frustrated that I wasn't told what was going on under the hood. So, I decided to make my own.
Data Processing
Each run that I tracked generated a .fit file containing pace, heart rate, distance, elevation, and more. I built a command line tool to parse these files into clean CSVs and tag each by run type (long run, threshold, base, etc.). This let me compare how different types of training affected fitness and performance, and made it easy to create consistent, structured data for later analyses.
Race Prediction
My latest project used six weeks of training data to predict my 50k mile splits and finish time. I trained two models, a linear regression and a small neural network, using mile-by-mile net elevation gain, altitude, and average heart rate as inputs with an output of mile pace. While pace depends on many factors, such as terrain, fatigue, fueling, etc., these three inputs had the clearest, quantifiable relationships with my pace (Figure 1). Pace scaled roughly linearly with elevation gain, shifted by altitude, and modulated by heart rate.
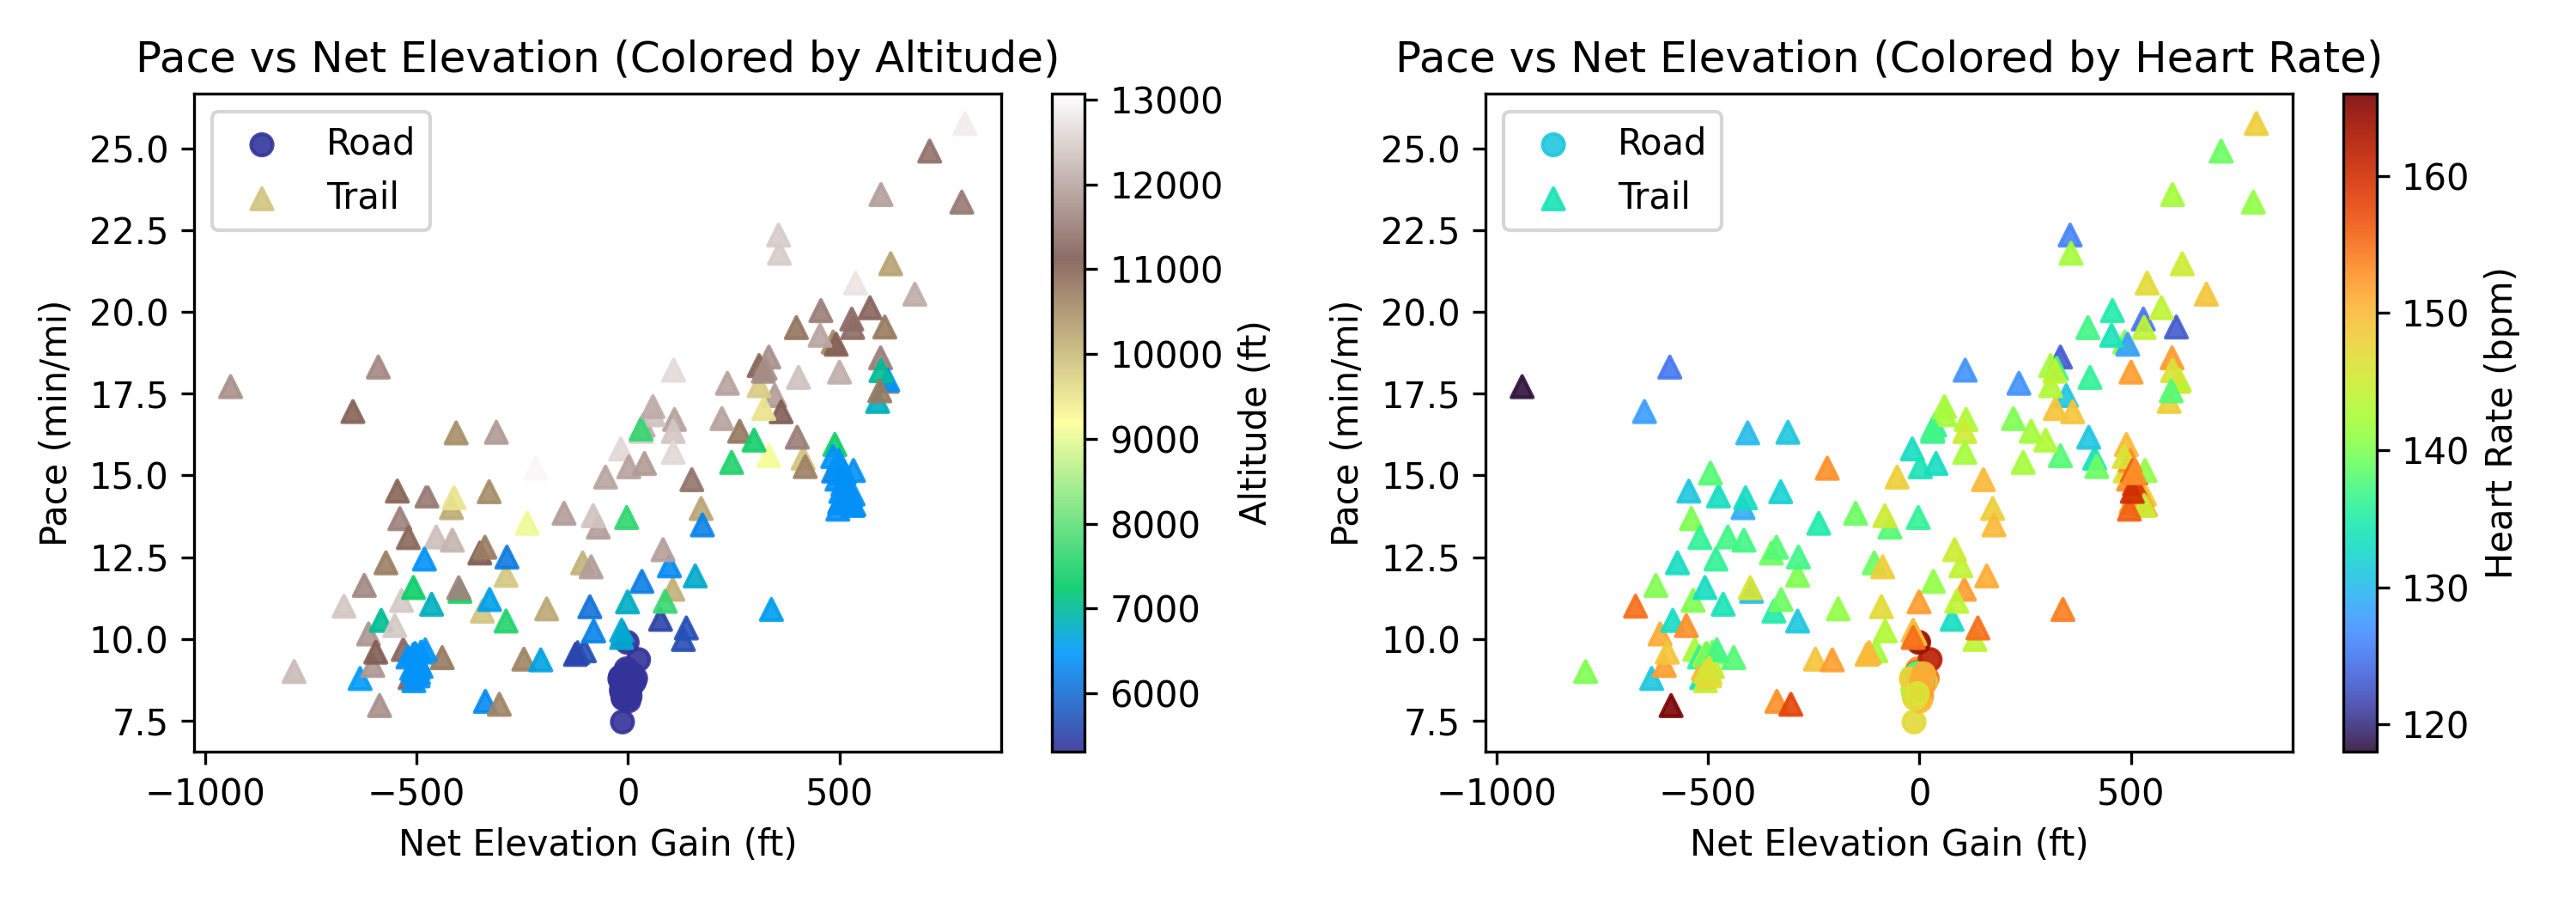
Figure 2: Relationships between pace and elevation gain, altitude, and heart rate
With about 200 samples, the dataset was small for a neural network, but I wanted to compare how a simple linear model versus a nonlinear one handled the data.
Prediction and Results
I trained both models, got my predictions which I used to help plan out my race and fueling strategy, and then ran the race. Afterwards, I compared these predictions to my actual splits. Figure 2 shows these results. The linear regression was closer to my total time, estimating just under seven and a half hours, while the neural network predicted around seven hours but matched my mile-by-mile pacing surprisingly well through the first half of the race. In the second half, I slowed more than either model expected mostly from fatigue and increasingly technical terrain, neither of which were represented in the data.
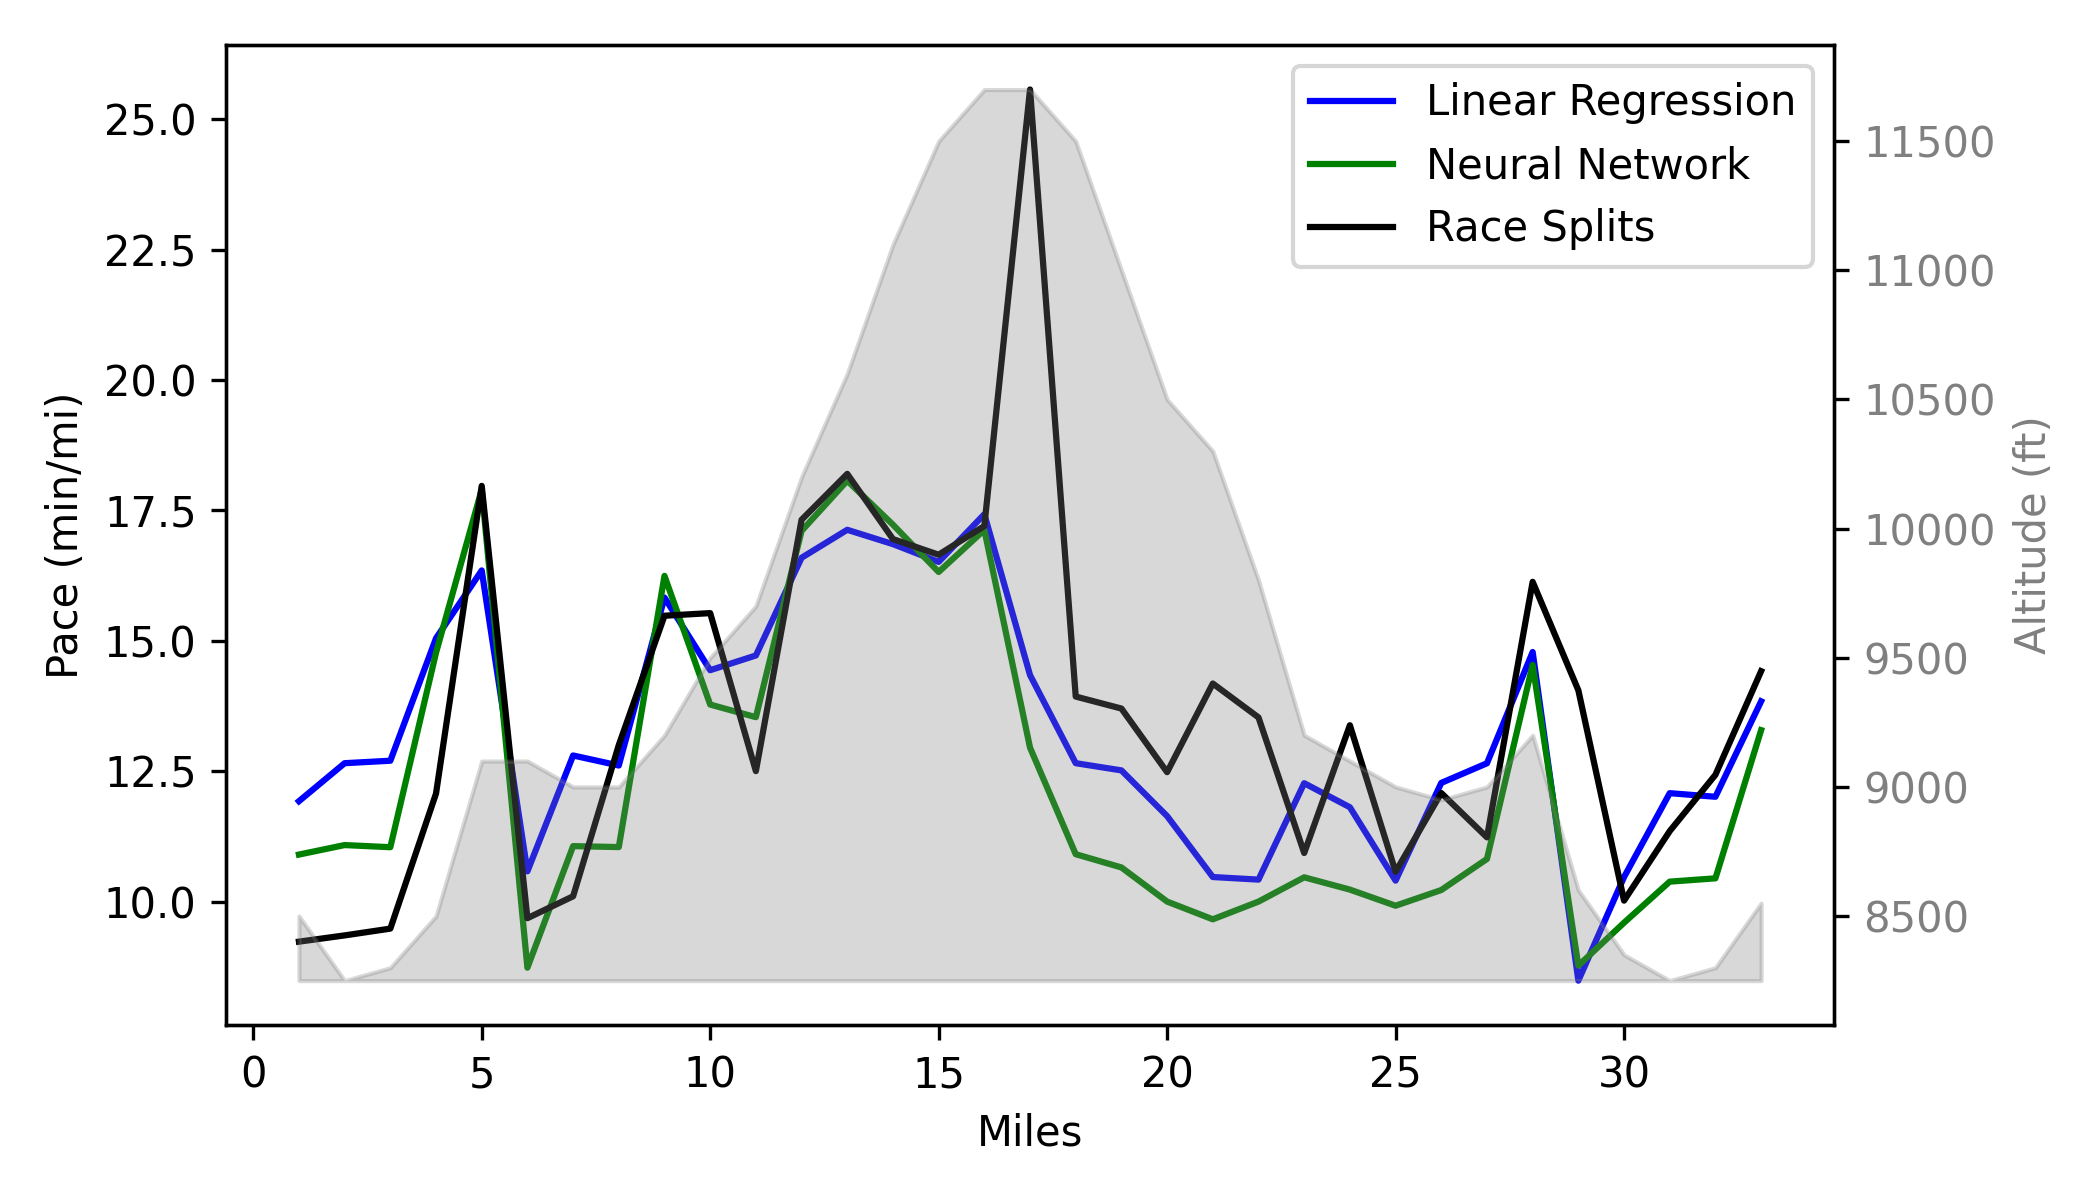
Figure 3: Comparison of predicted mile splits (linear regression and neural network) versus actual race performance
In future iterations, I think this model would benefit from incorporating a metric for fatigue, especially as I start running longer races. In an earlier version, I tried using distance covered as an input to capture fatigue, but since I'd never run 33 miles in one go before the race, both models struggled to extrapolate and predicted unrealistically slow times. As I gather more data and predict future races, I plan to find a new way to include fatigue, perhaps by using previous mile's pace and net elevation gain as inputs, which would implicitly capture fatigue. All things to try before the next race!
Code Availability
The code for this project is available on my GitHub repository runlytics.