Research
While working at Handix Scientific, I had the opportunity to apply my analytical and computational skills in a research-driven setting. Coming from a background in mathematics, it felt natural to formalize complex scientific questions and develop algorithms and tools to answer them.
At Handix, I led the data analysis for SAIL-Net, a 1.5-year DOE-funded field campaign in the East River Watershed of Colorado. The project deployed a network of six low-cost aerosol sensors to study how aerosol concentrations vary across complex mountain terrain. Understanding this variability is key for atmospheric models, which often struggle to represent conditions accurately in such regions.
Core Research Questions
The SAIL-Net campaign aimed to answer three core questions:
- What is the temporal variability of aerosols?
- What is the spatial variability of aerosols?
- How should measurement networks be designed to capture aerosol–cloud interactions?
The full findings were published, but here I'll highlight my analytical approach and the tools I used to explore these questions.
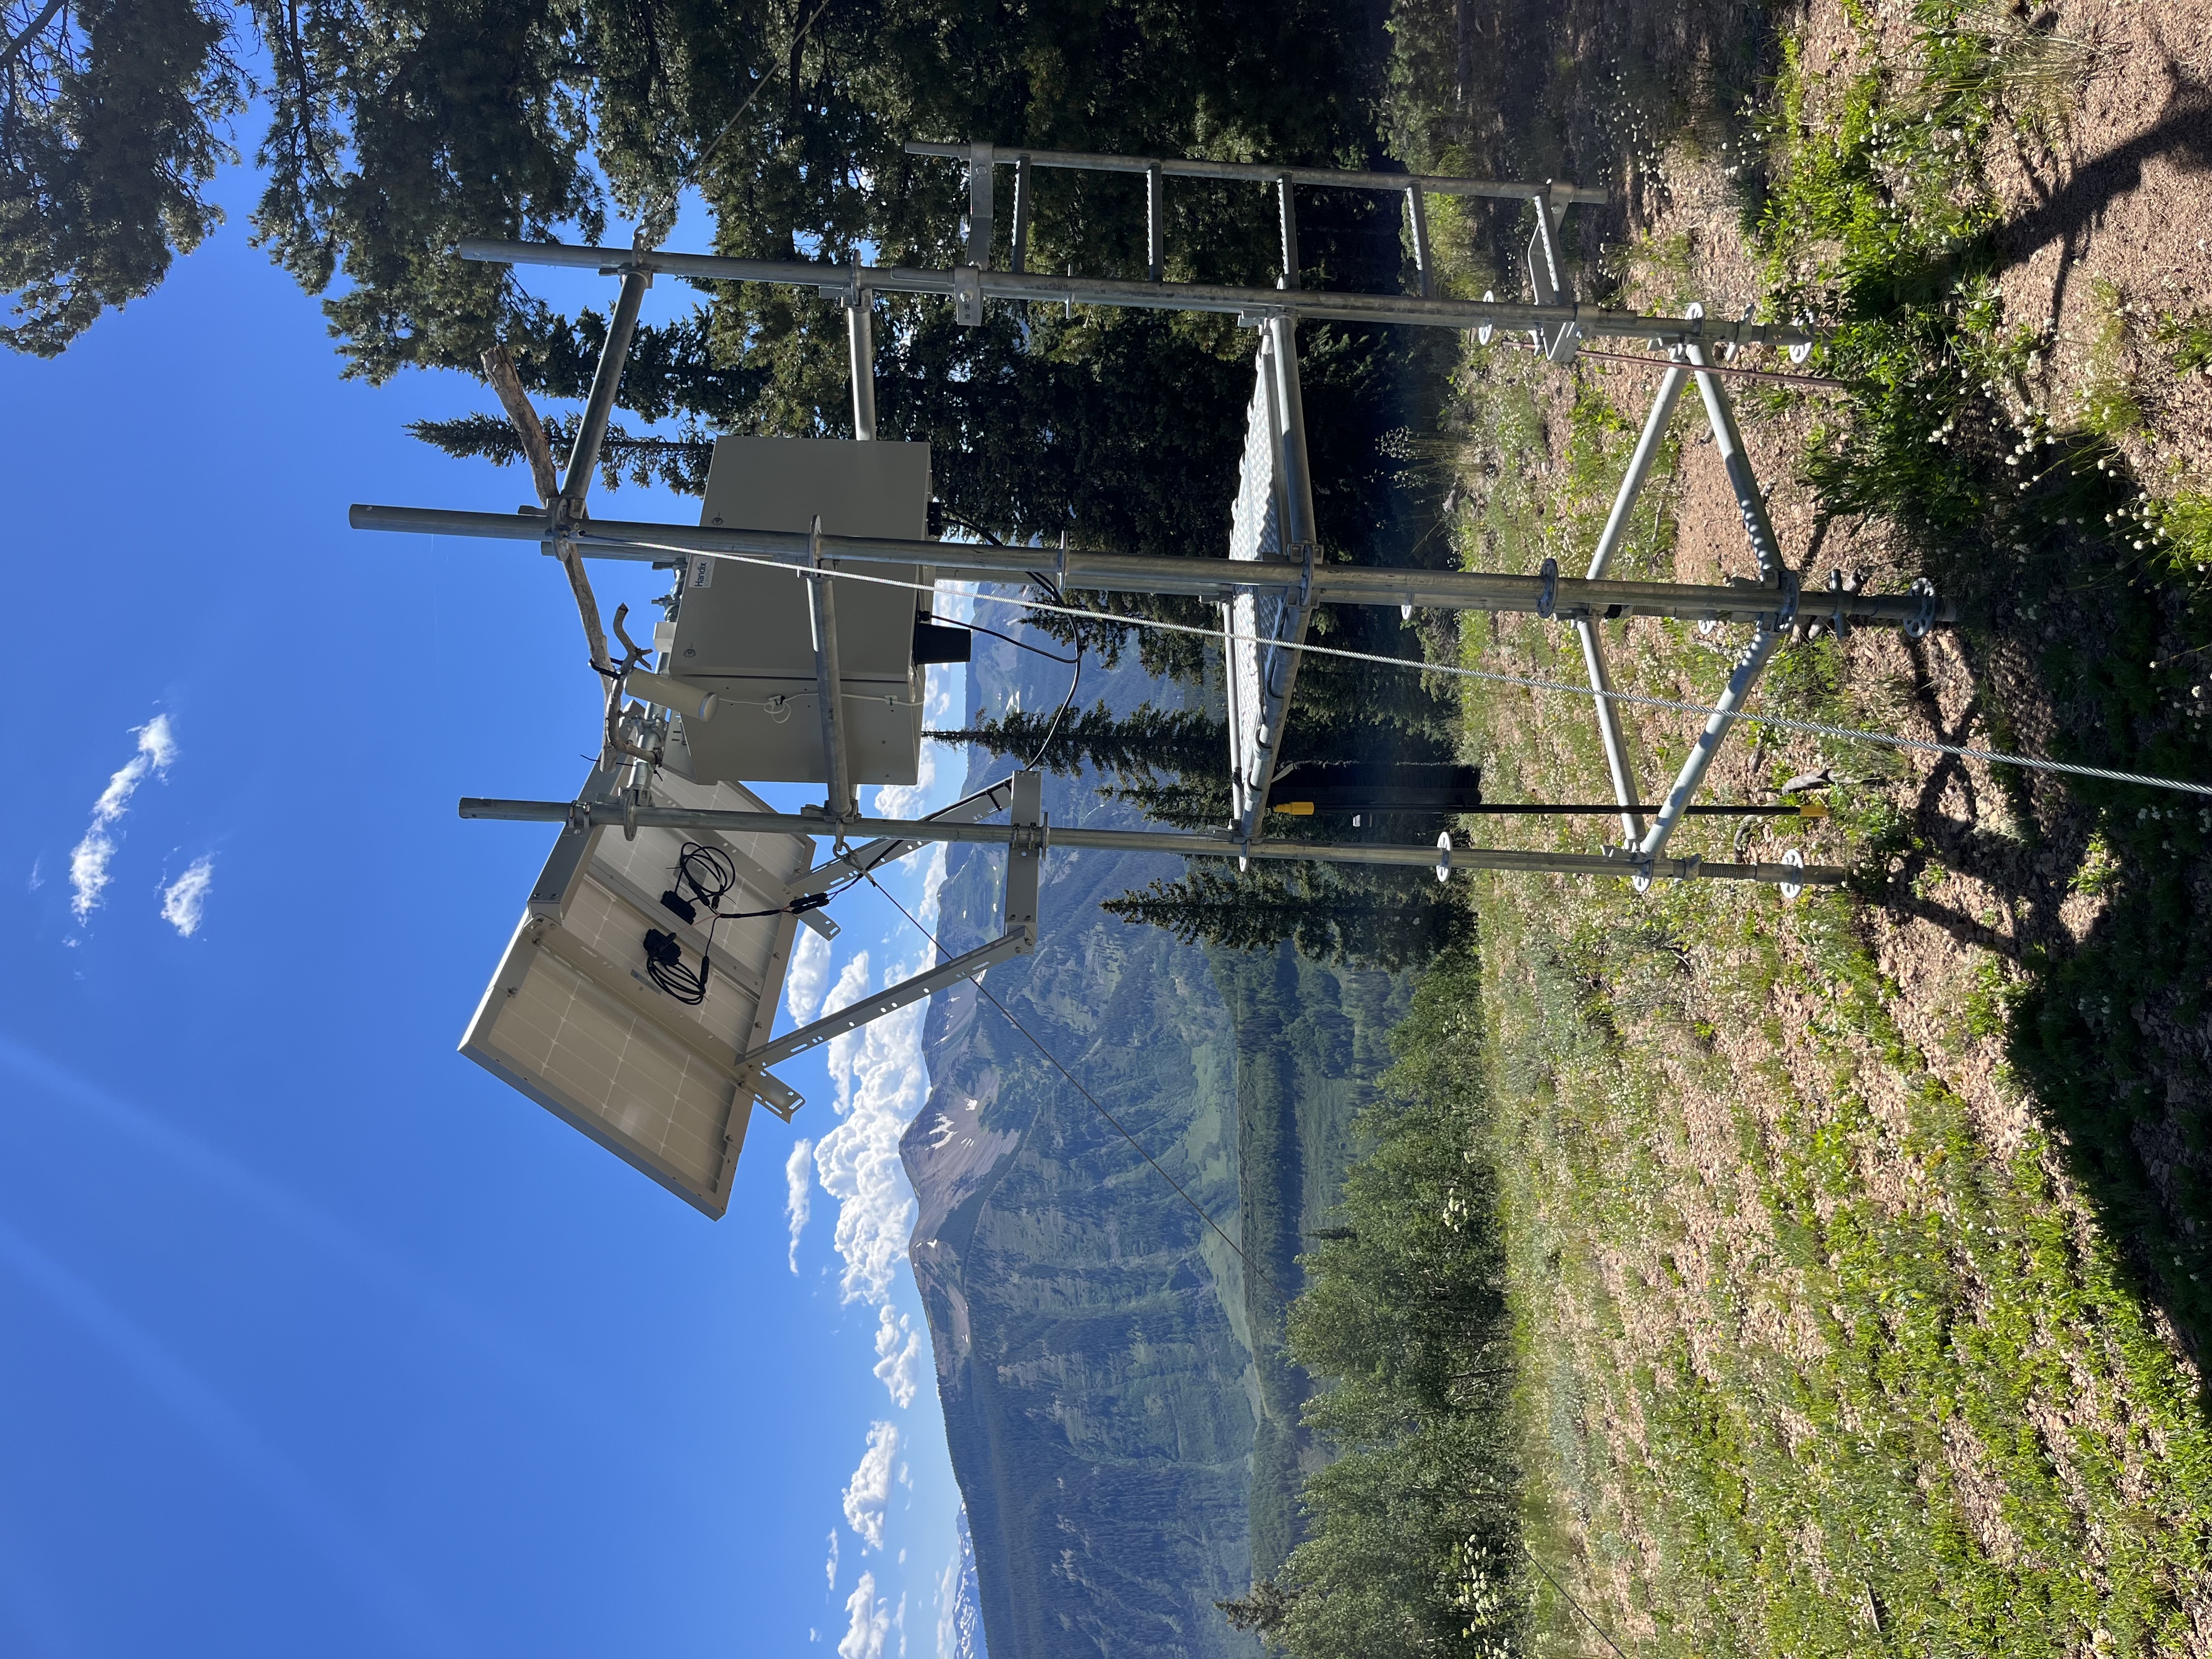
Figure 1: SAIL-Net monitoring site in East River Watershed (summer)
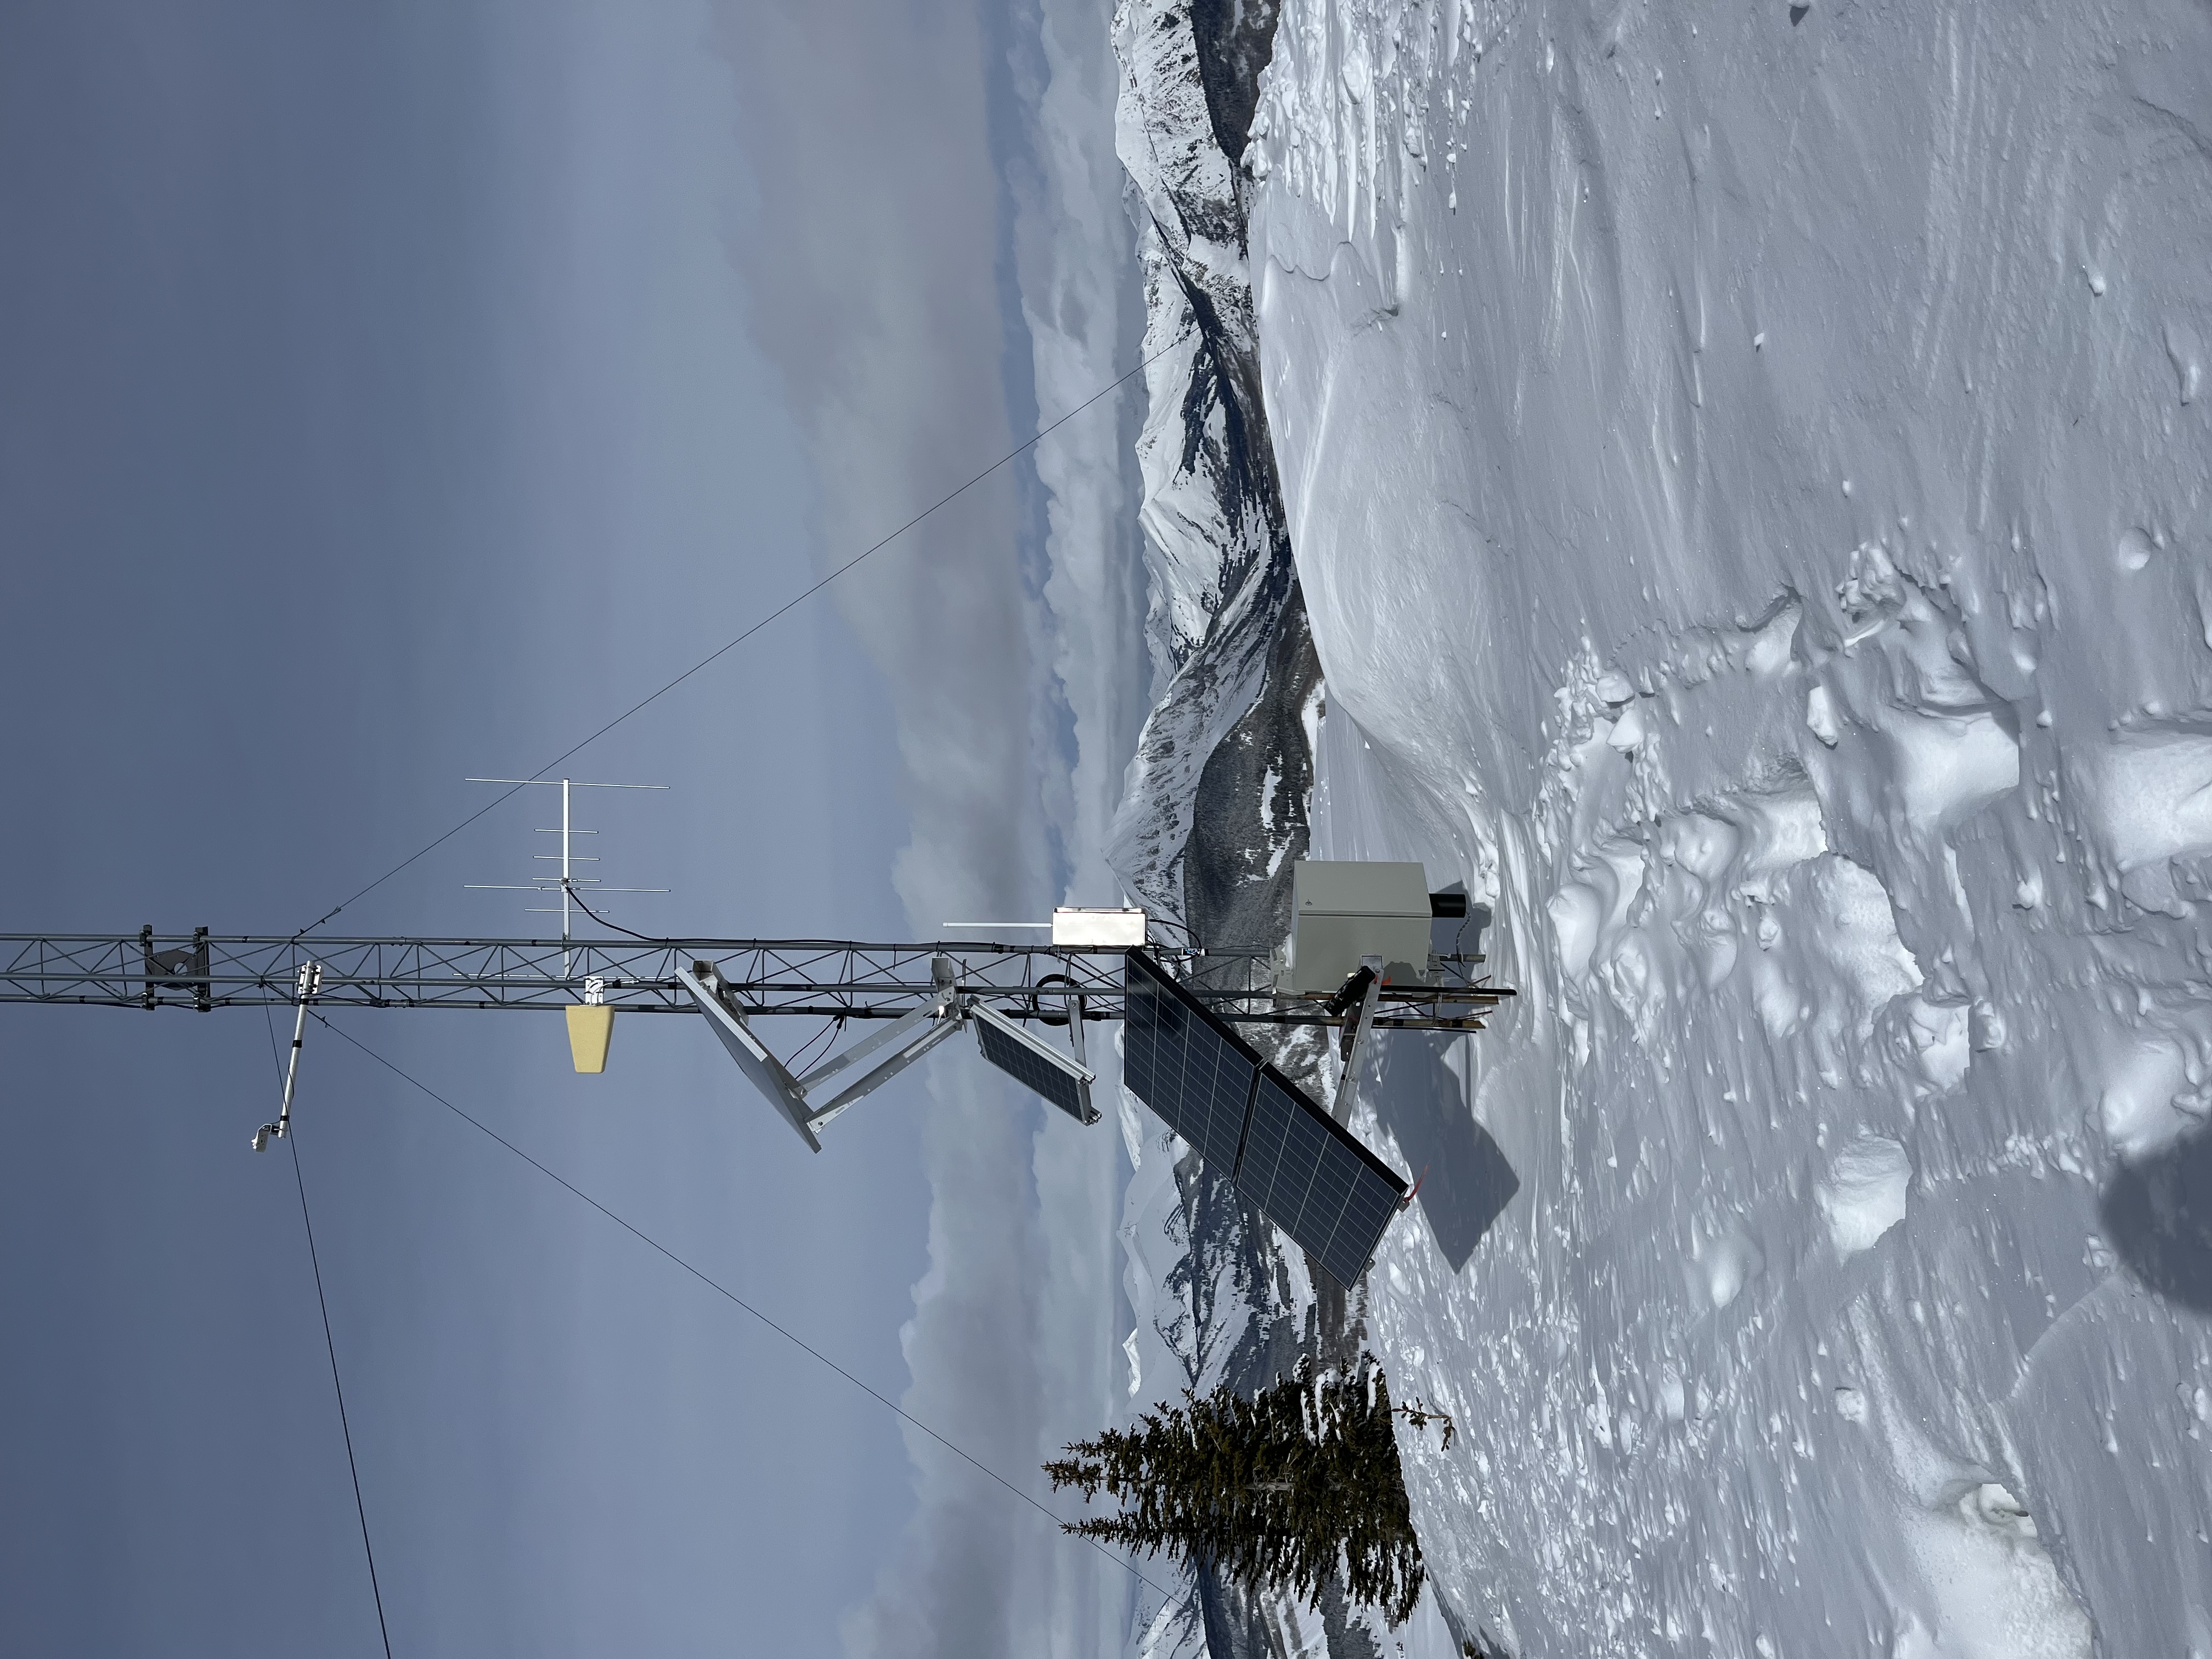
Figure 2: SAIL-Net monitoring site in East River Watershed (winter)
Uncovering Temporal Variability
Understanding temporal variability required analyzing patterns across multiple timescales (diurnal, seasonal, and interannual) while also comparing how these patterns evolved across sites. I developed statistical analyses and visualization pipelines in Python to characterize these changes and quantify their consistency across different locations.
Uncovering Spatial Variability
To study spatial variability, I examined how differences between sites related to their physical characteristics and spatial separation. While spatial proximity is often assumed to drive measurement similarity, my regression analyses showed that altitude was a far stronger predictor of aerosol similarity than horizontal distance. I also used a normalized coefficient of variation to quantify the overall variability across all six sites through time, revealing how spatial relationships evolved under different meteorological conditions.
Network Design
A major goal of the campaign was to inform measurement network design by identifying which sites best represented regional aerosol conditions. Using representation error metrics, I evaluated how well each site captured overall variability and how representativeness changed over time.
I also compared measurements from the fixed sites to tethered balloon flights conducted during the broader SAIL campaign. Interestingly, the six fixed sites, distributed across elevation gradients, often produced "pseudo–vertical profiles" that mirrored the balloon observations, which was further evidence that aerosol variability in complex terrain is strongly tied to altitude.
Final Remarks
This project was a blend of computational rigor and field-based discovery. I shaped the analysis from start to finish by building data pipelines, performing statistical analyses, and interpreting results within a physical context. I also went on several field work visits, snowshoeing and skiing to remote monitoring sites to service instruments and validate data. It was a perfect intersection of my love for nature, mathematics, and hands-on science.
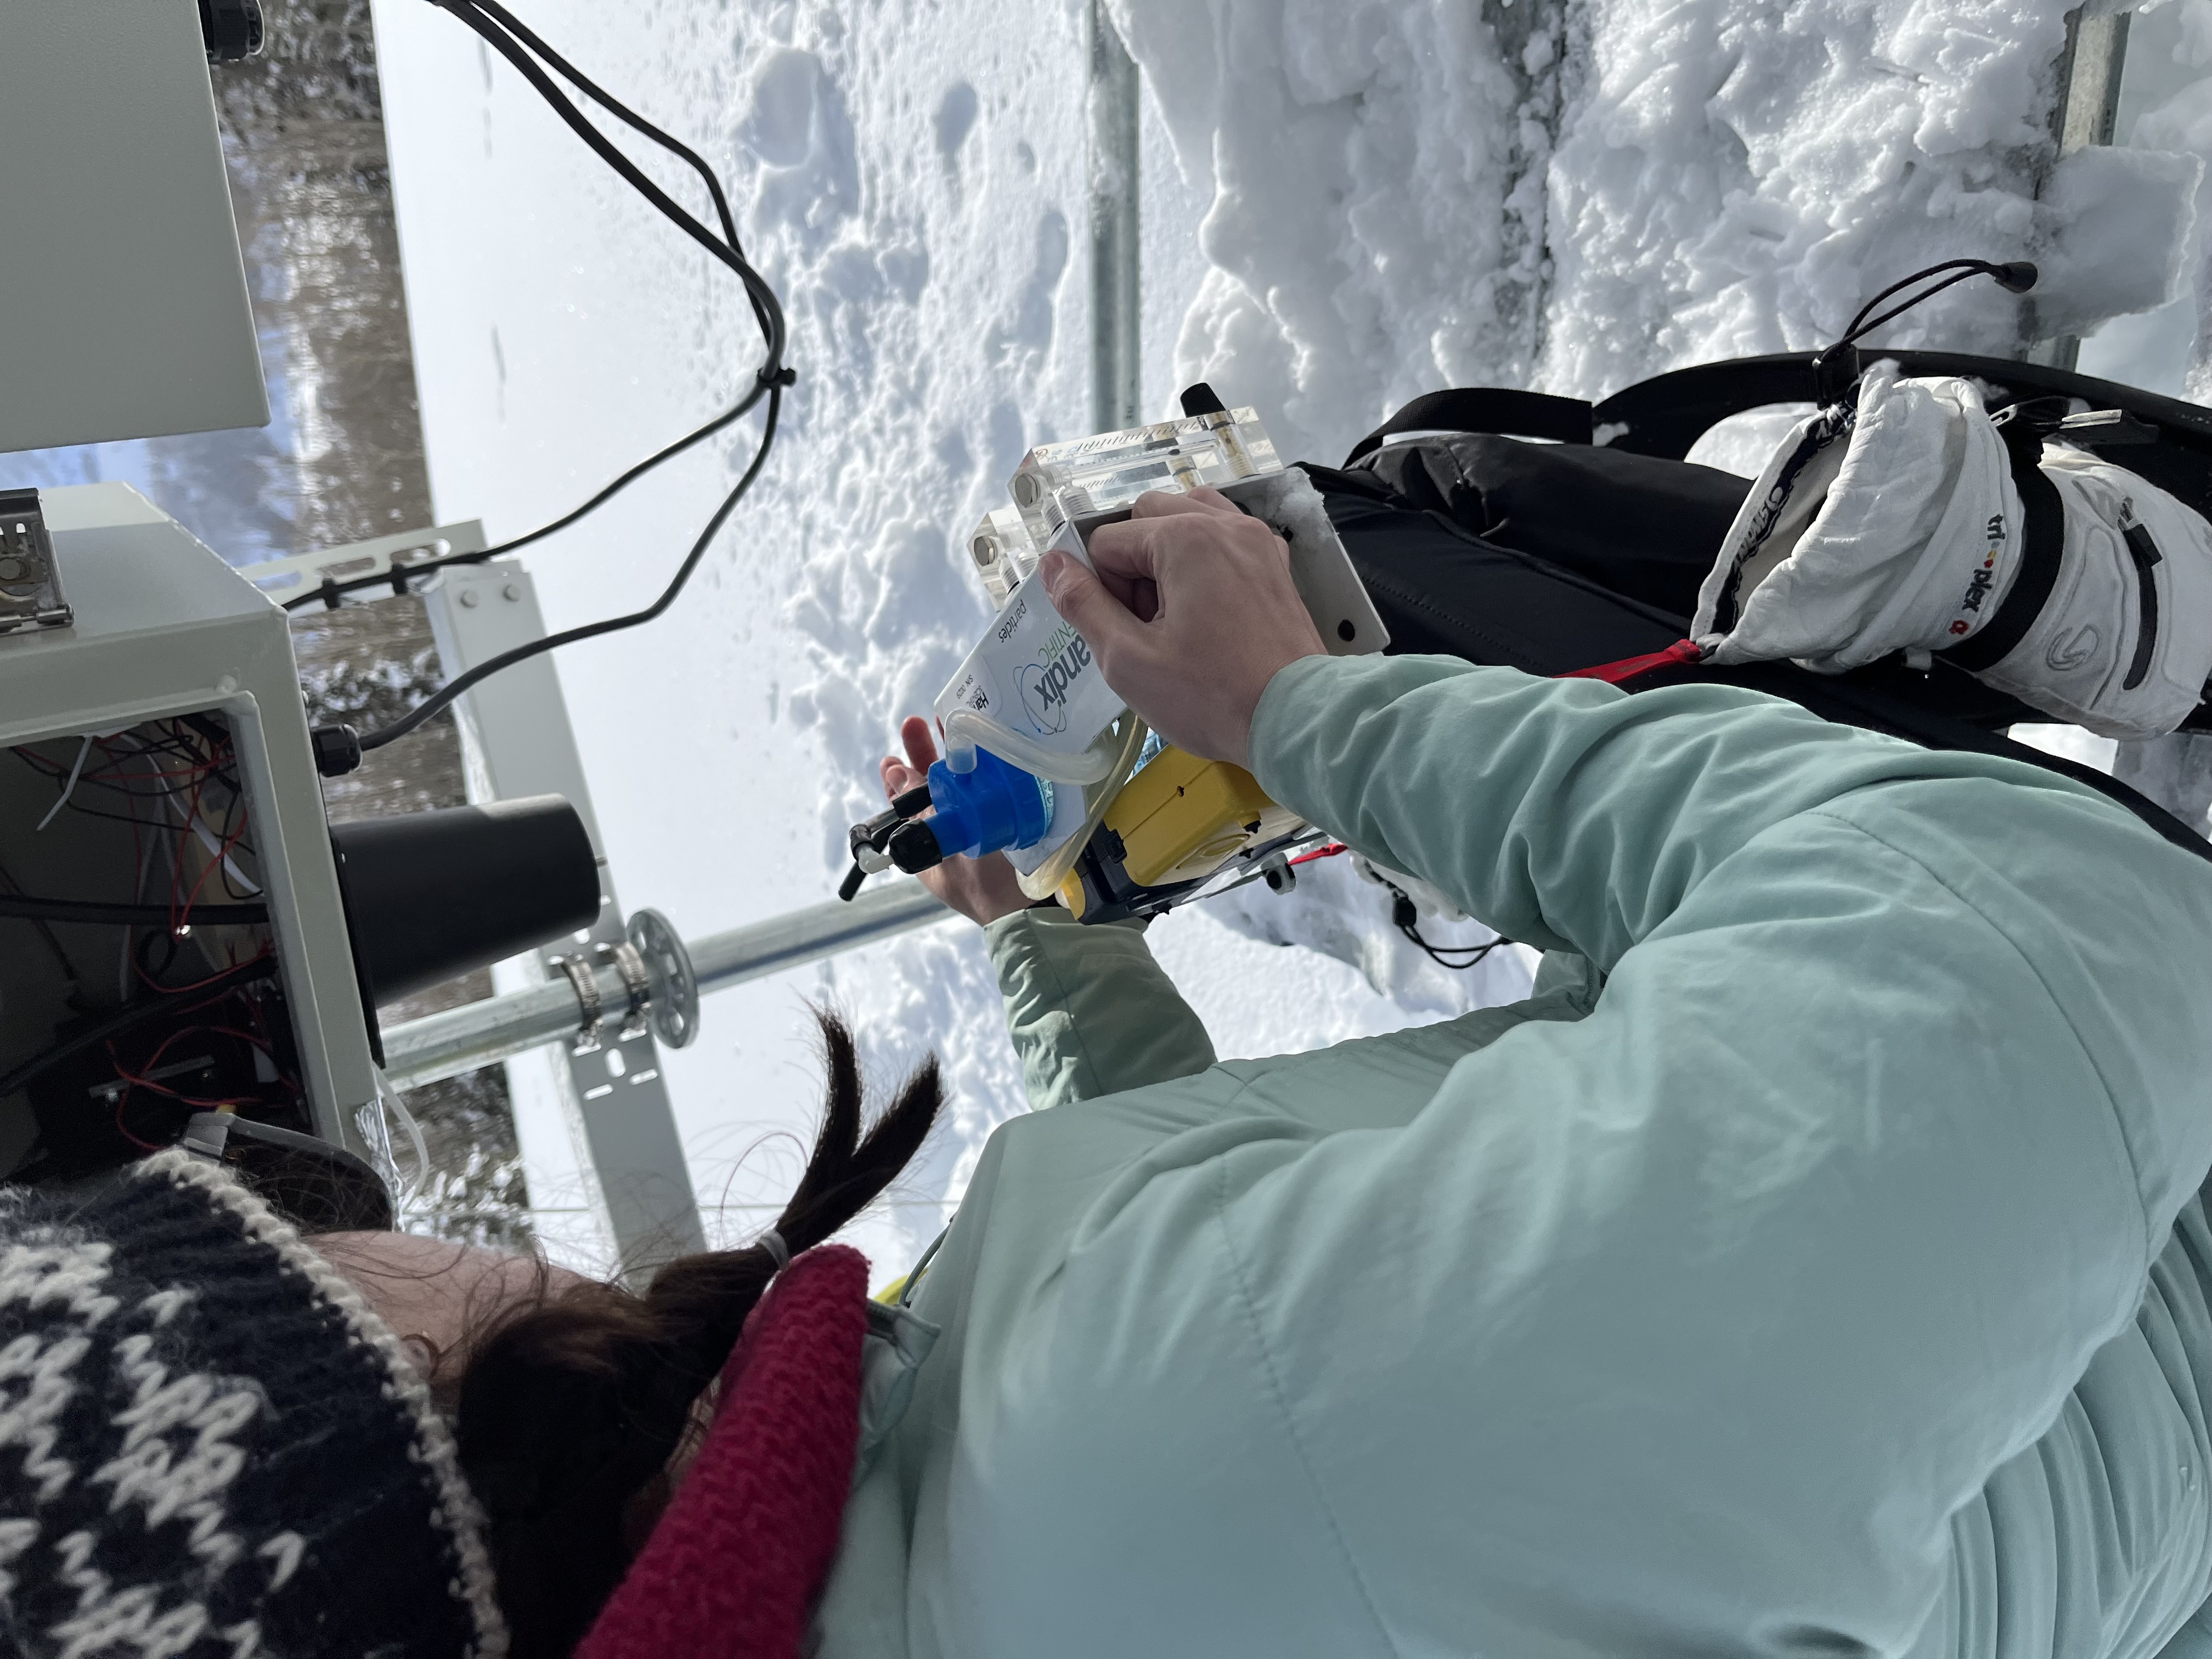
Figure 3: Field work at the SAIL-Net sites.
Code Availability
To support future research, I made the code from my analyis publicly available as a starting point for others working with the SAIL-Net dataset, which can be accessed through the ARM Data Discovery. The repository for this analysis is available on my GitHub.